
The growing complexity in Ethereum price trend over the $2,000 level warns of increased volatility. Will a post-retest reversal navigate a rally to $2,500?
Amid the growing anticipation of the crypto market reclaiming a $3 trillion valuation, Ethereum maintains dominance above the $2,000 mark. After recently retesting the psychological $2,000 level, Ethereum is trading at $2,954, with an intraday pullback of 1.28%.
However, a lower price rejection and a short-term recovery on the 4-hour chart suggest a potential bounce-back. Will this post-retest reversal help Ethereum reach the $2,500 mark?
Ethereum Price Analysis Hints Extended Recovery
On the 4-hour price chart, Ethereum’s price trend shows a reversal rally with a breakout from a consolidation range. Ethereum marked an upswing near the $2,100 level, crossing above the 100 EMA line.
However, a higher price rejection has led to a retest of the 100 EMA line near the $2,000 psychological level. Despite this minor setback, the overall trend remains bullish, with the uptrend maintaining its bullish momentum.
The short-term recovery also increases the likelihood of a positive crossover between the 50 and 100 EMA lines.
Ethereum ETFs Mark Net Zero Flow
As Ethereum’s price trend hints at a potential bounce-back, institutional investment in the token reported a net-zero flow on March 24. This marks the seventh day of net-zero flow since the inception of Ethereum ETFs in the U.S. market.
Ethereum ETFs
Currently, the total net assets held by Ethereum ETFs amount to $7.17 billion, or 2.85% of Ethereum’s market cap. Meanwhile, the cumulative net inflow stands at $2.42 billion since inception.
Bulls Gain Momentum Amid Post-Retest Reversal
With short-term recovery and growing prospects of a bull run, sentiment in the Ethereum derivatives market is turning bullish. The Ethereum long/short ratio chart shows that long positions have risen to 55% of total contracts in the past four hours.
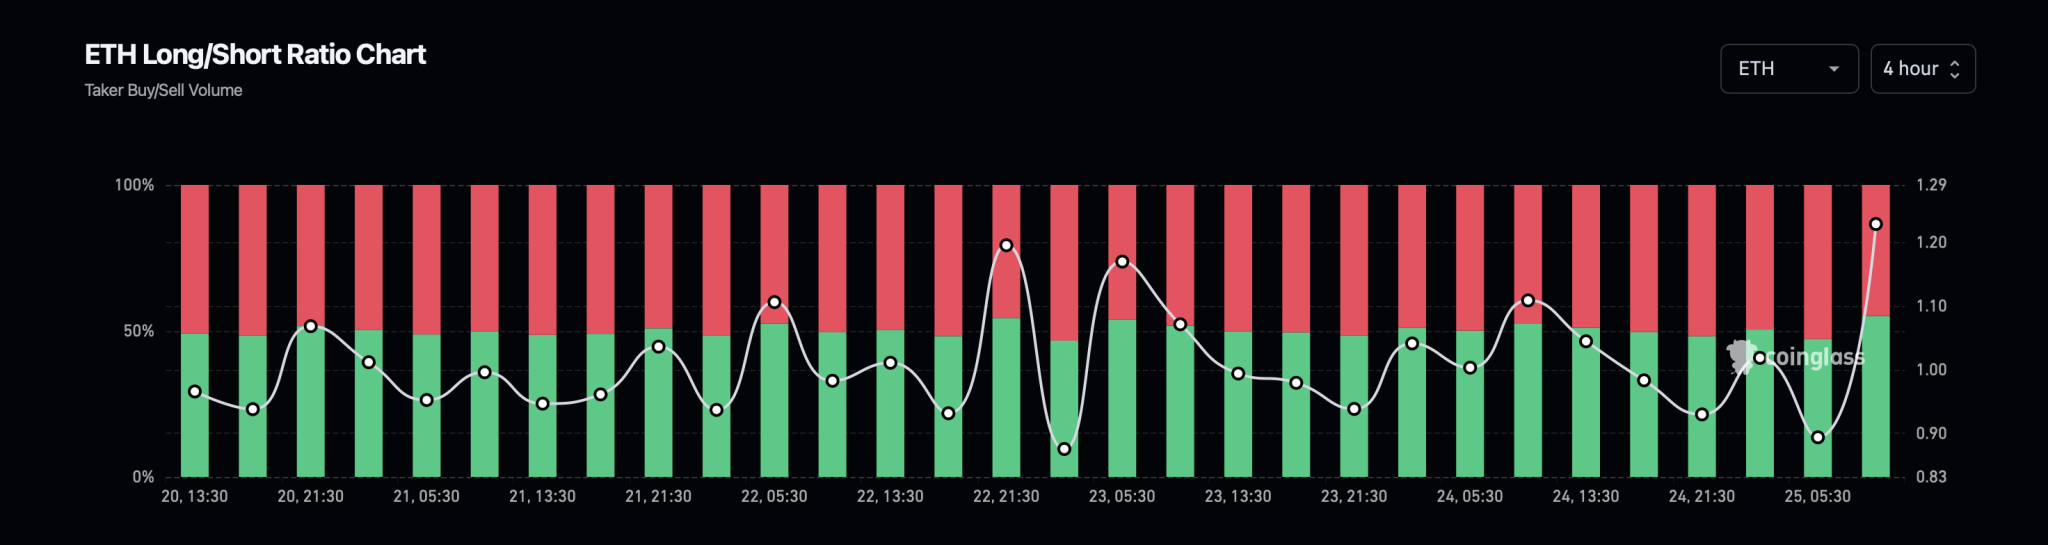
Ethereum LongShort Chart
This brings the long-to-short ratio to 1.2287, reflecting a significant increase in bullish positions. Furthermore, the open interest of Ethereum derivatives has increased to $21.75 billion, showing a 3.21% surge, with a positive funding rate of 0.0026%.
Analysts Target Extended Recovery in ETH Prices
As Ethereum shows signs of recovery, crypto analyst Gert van Lagen has highlighted the potential formation of an inverted head-and-shoulders pattern on the weekly chart. According to the analyst, with Ethereum bouncing off the $1,800-$2,000 support level, the price trend is close to completing the bullish pattern.
The short-term recovery could mark the start of the right shoulder of the pattern, with the neckline positioned near the $4,000 psychological mark.
$ETH [1W] bounces off the ~$1800-$2000 support range while having formed a complex iH&S structure, targeting ~$18k.
This support level acted as resistance during the ‘head’ phase. Now price successfully retested it as support.
Now the Left and Right shoulders are well-aligned. pic.twitter.com/909aRoeajD
— Gert van Lagen (@GertvanLagen) March 24, 2025
Meanwhile, Michael van de Poppe identifies crucial resistance in Ethereum’s short-term recovery. The analyst highlights a supply zone between $2,100 and $2,150.
A bullish breakout above this supply zone could drive Ethereum to a 30% surge, potentially reaching the $2,800 mark.
 Price Prediction for March 1")


