Toncoin Bullish Rise Threatens The $3.00 Barrier

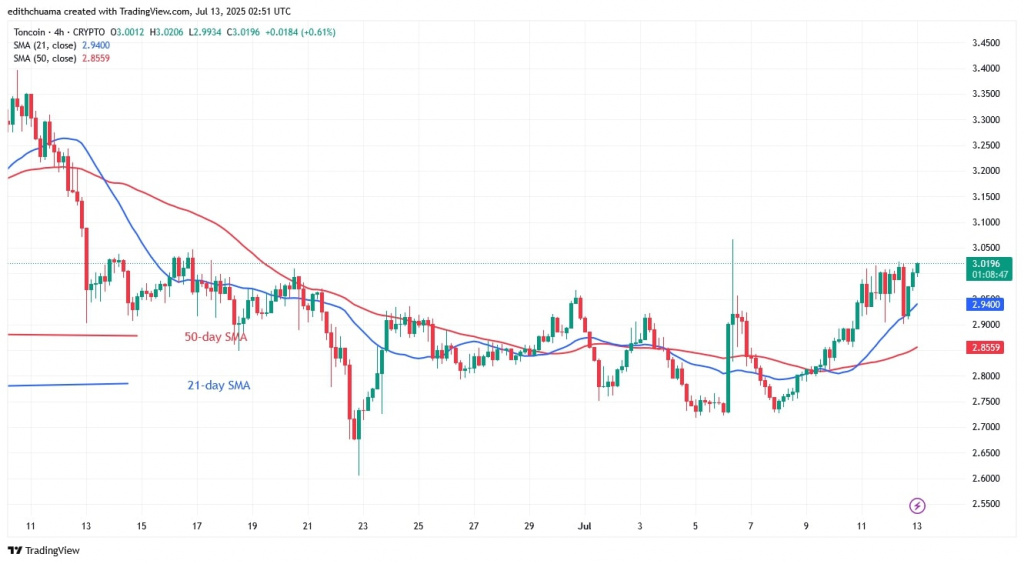
The price of Toncoin (TON) has risen above the moving average lines since the bottom of the chart.
Toncoin price long-term prediction: bullish
This is the second time that buyers have tried to push the price above the moving average lines. On July 6, TON fell well below the moving averages as buyers failed to keep the price above the moving averages.
Today, TON is expected to rise to historical highs of $3.40 and $3.60. If the bulls break through the $3.60 level, TON will break out of its sideways trend between $2.60 and $3.60. TON will start its uptrend. If the price of the cryptocurrency falls below the 50-day SMA, the altcoin will return to its previous range above the $2.60 support.
Toncoin price indicators analysis
TON has risen above both the 21-day and 50-day moving average lines. This indicates that the cryptocurrency could be in an uptrend. Since June 12, as reported by Coinidol.com, TON has been trading in a bearish trend zone. The breakout will indicate the continuation of the uptrend. On the 4-hour chart, the price bars are above the moving averages.
Technical Indicators
Resistance Levels: $6.00, $8.00, $10.00
Support Levels: $5.00, $3.00, $1.00
What is the next step for Toncoin?
Toncoin has resumed its uptrend on the 4-hour chart. However, the uptrend has come to an end after reaching the $3.00 resistance level on July 11.
In the last 48 hours, the altcoin has been trading above the 21-day SMA but below $3.00. If the bears break through this support, the current uptrend will come to an end. The altcoin will continue to rise if the bulls break above $3.00.

Disclaimer. This analysis and forecast are the personal opinions of the author. They are not a recommendation to buy or sell cryptocurrency and should not be viewed as an endorsement by CoinIdol.com. Readers should do their research before investing in funds.


