Stellar (XLM) Price Shows Signs of Life Despite Bearish Pattern

Stellar (XLM) price faces conflicting technical signals as its downtrend continues to deepen, with the coin dropping 29% over the past 30 days from its highest levels since 2021. A recent death cross formation on December 20 suggests mounting bearish pressure, though a spike in buying activity could signal a potential trend reversal.
The DMI indicates strengthening downward momentum with an ADX above 25, yet the CMF’s dramatic jump to 0.19 shows significant institutional accumulation. This technical divergence sets up a critical phase for XLM, with immediate support at $0.31 and potential resistance at $0.40 if bullish momentum takes hold.
XLM DMI Shows a Strong Bearish Trend
The Directional Movement Index (DMI) for Stellar shows increasing trend strength, with its Average Directional Index (ADX) rising from below 20 to 26.8 in just four days.
ADX measures trend strength regardless of direction, with readings below 20 indicating a weak trend, 20-25 suggesting a developing trend, and values above 25 signaling a strong trend. When ADX rises above 25, it suggests the current trend is gaining momentum and likely to continue.
XLM DMI. Source: TradingView
The current readings of D+ at 13.2 and D- at 21.5, combined with the rising ADX at 26.8, paint a bearish picture for XLM price. Since D- (negative directional indicator) is higher than D+ (positive directional indicator), this confirms the trend’s bearish nature.
The ADX rising above 25 suggests this downward movement is strengthening and could continue, with the significant gap between D- and D+ reinforcing the likelihood of sustained downward price action.
Stellar CMF Jumped In The Last 24 Hours
The Chaikin Money Flow (CMF) for XLM has experienced a dramatic increase, jumping from 0.03 to 0.19 in just 24 hours.
The CMF indicator combines price and volume to measure buying and selling pressure. Positive values above zero indicate accumulation, and negative values suggest distribution. The magnitude of the reading (closer to +1 or -1) indicates the strength of the money flow.

XLM CMF. Source: TradingView
A CMF spike to 0.19, the highest reading since November 24, signals strong buying pressure and institutional accumulation.
This substantial increase from near-neutral territory (0.03) to a significantly positive value suggests a notable shift in sentiment, with money flowing into Stellar at an accelerated rate. When CMF shows such a dramatic positive shift, it often precedes upward price movement as it indicates strong buying conviction from larger market participants.
XLM Price Prediction: Will Downtrend Prevail?
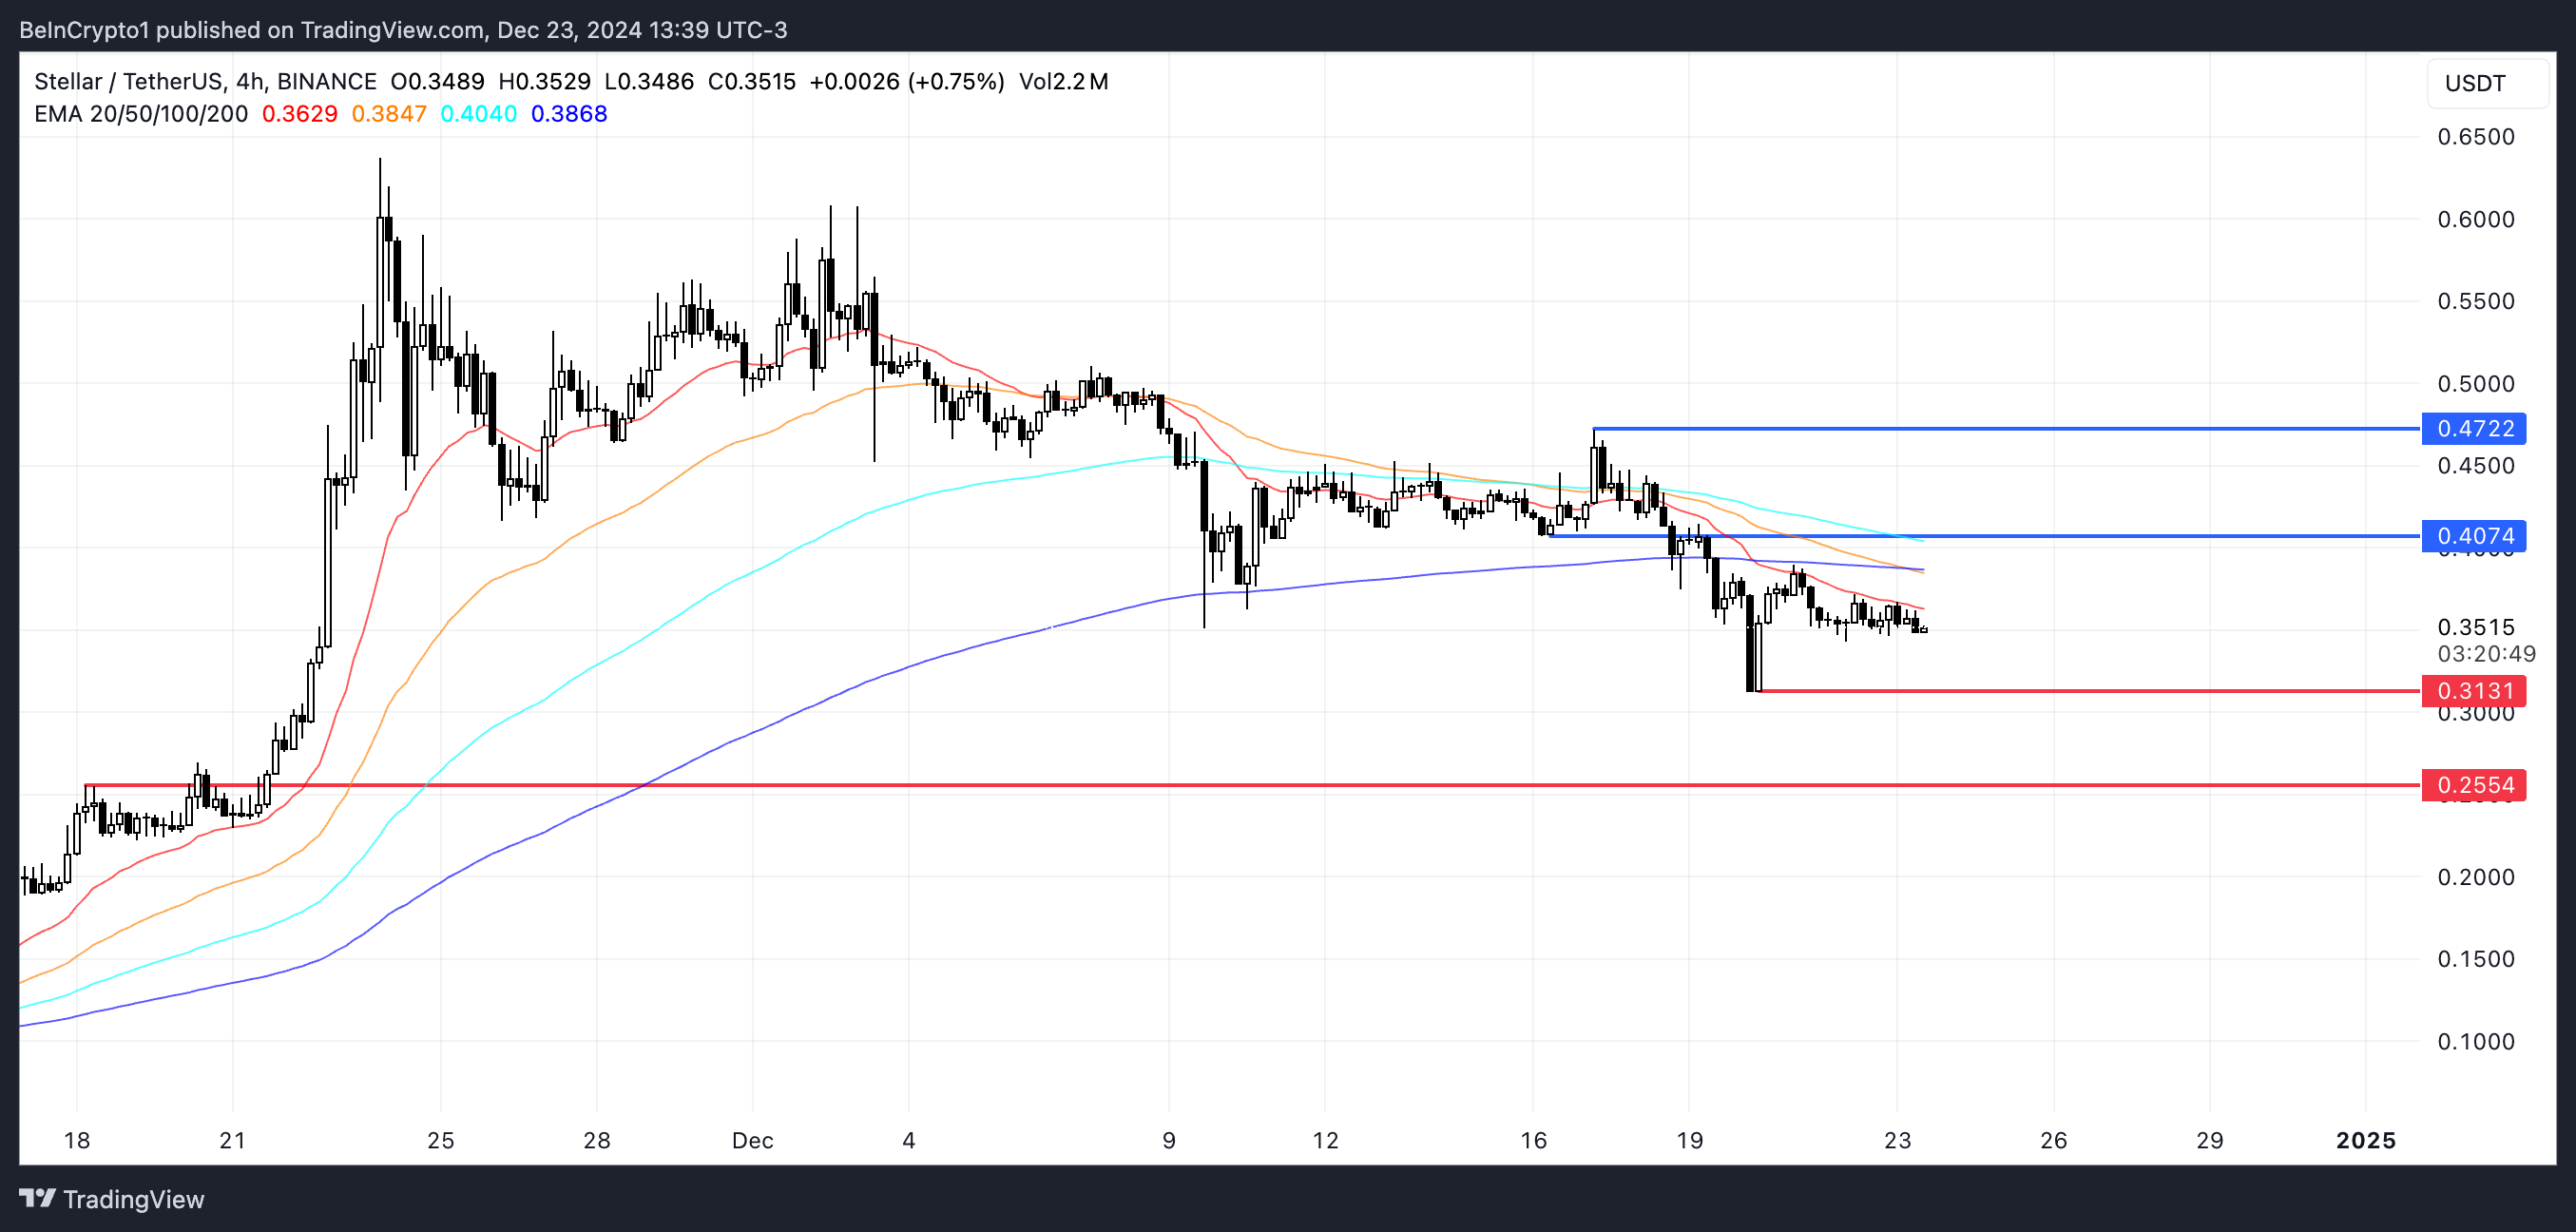
XLM price has recently seen a significant bearish signal with the formation of a death cross on December 20, where the short-term moving average crossed below the long-term average.
This technical pattern suggests increased selling pressure, with the immediate support level at $0.31 being crucial for price stability. If this support fails to hold, XLM price could experience further decline toward the $0.25 level, representing a significant downside risk.

XLM Price Analysis. Source: TradingView
However, recent Chaikin Money Flow data suggests potential for a trend reversal and upward momentum. If Stellar price can capitalize on this positive money flow and establish an uptrend, it could challenge the immediate resistance at $0.40.
A breakthrough above this level could pave the way for further gains toward $0.47, presenting a potential 34% upside from current levels, though this scenario requires sustained buying pressure to overcome the current bearish technical setup.


