
Ethereum (ETH) has experienced a 18% price decline the past month. However, in the last 24 hours, ETH showed a modest 1.8% recovery attempt, climbing toward its current price near $1,843, possibly a bullish outlook for ETH price in April.
While Ethereum co-founder Vitalik Buterin continues his philanthropic donations—reportedly sending over $1 million worth of ETH recently to projects including Railgun and Zuitzerland—overall market sentiment for ETH currently remains cautious based on technical indicators.
Buterin Plays VC
Blockchain analysis platform Spot On Chain provided details on recent Buterin transfers. He’d sent 274.1 ETH (worth ~$500K) described as a “donation or grant.” The funds went to a multisig wallet associated with Web3 researcher @0xisla, the developer behind the Zuitzerland project, described as a “network state sandbox.”
Vitalik Buterin (@VitalikButerin) just sent 274.1 $ETH ($500K) as a donation or grant to a multisig deployed by @0xisla, the developer behind @zuitzerland.
5 days ago, he also sent 250 $ETH ($456K) to the privacy protocol #Railgun, most likely for donation purposes, as he had… pic.twitter.com/I73oUp8xXW
— Spot On Chain (@spotonchain) April 1, 2025
A couple of days prior, Buterin also reportedly sent 250 ETH (worth ~$456K) to the cryptocurrency mixing service Railgun. This transfer occurred despite ongoing global regulatory focus and crackdowns targeting such privacy-enhancing platforms.
Related: Bitcoin and Ethereum ETFs Display Contrasting Trends in Capital Flows
What Do Ethereum’s Technicals Show?
Current technical indicators provide context for ETH’s recent price action. The Bollinger Bands (BB) indicate ETH currently trades near its lower band support level, calculated around $1,778. Trading near the lower BB often suggests an asset is in, or approaching, technically oversold conditions.
Historically, when an asset reaches its lower Bollinger Band support, a price rebound frequently follows, unless that crucial support level breaks decisively under sustained selling pressure.
Looking upward, the midline of the Bollinger Bands, near $1,940, now acts as the immediate overhead resistance level for ETH. The upper BB band near $2,102 represents the next significant bullish price target area.
Additionally, the Relative Strength Index (RSI) on the 4-hour timeframe reads near 36.96. This level approaches the traditional oversold threshold (typically below 30). While a low RSI can signal that selling pressure might be nearing exhaustion, potentially allowing for a price bounce if buying interest increases, it does not yet confirm a definite reversal.
The RSI’s recent trend remains downward, indicating underlying weak price momentum persists for now.
The Moving Average Convergence Divergence (MACD) indicator also signals weak momentum currently. Although the MACD line itself recently moved above its signal line (often a preliminary bullish hint), both lines remain in negative territory.
Related: Vitalik Buterin Warns of DAO Vulnerabilities, Questions ‘Renting’ Votes
Therefore, the market currently lacks strong technical confirmation of a trend reversal without either a more decisive bullish MACD crossover into positive territory or a sustained RSI recovery back above levels like 30 and ideally 40.
Analyst: Is the ETH Bottom In?
Crypto analyst “Crypto Caesar” noted that ETH is currently testing crucial longer-term price levels. He believes the second-largest cryptocurrency needs to hold these zones to establish a bottom before potentially starting its next major leg upward.
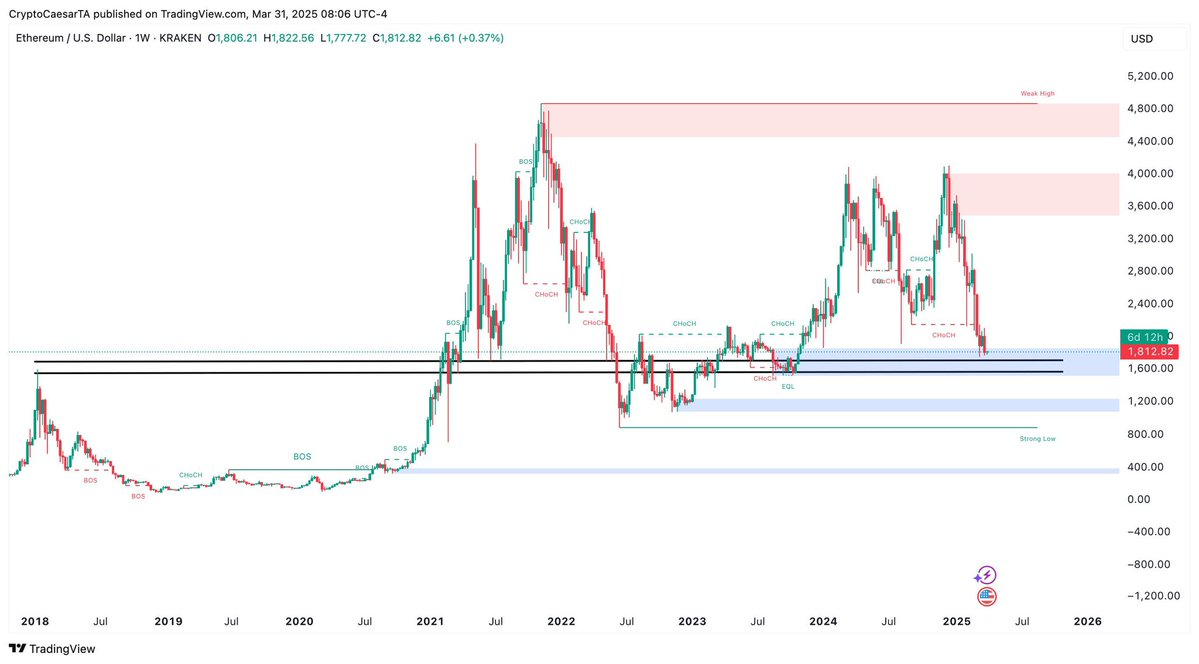
A chart shared by this analyst shows key potential support lying between $1,600 and $1,700 based on historical price structures. While Crypto Caesar believes a rebound could initiate from this broader zone, he also outlined alternative scenarios.
A sustained bearish case, he suggested, could involve ETH retesting the $1,187 price support (identified as a 2.168 Fibonacci level) sometime in April. Conversely, a definitive bullish scenario would require ETH to eventually reclaim the significant $3,000 price level.
Disclaimer: The information presented in this article is for informational and educational purposes only. The article does not constitute financial advice or advice of any kind. Coin Edition is not responsible for any losses incurred as a result of the utilization of content, products, or services mentioned. Readers are advised to exercise caution before taking any action related to the company.


