
After a powerful move from below $0.00001800 earlier this month, Bonk price today is consolidating above the $0.00002500 level. The meme coin recently tested its 78.6% Fibonacci retracement and is trading within a tight range just under its immediate resistance at $0.00002625. Despite short-term volatility, bulls have maintained control for the past week as technical and derivatives data reflect a sustained bullish bias.
What’s Happening With Bonk’s Price?
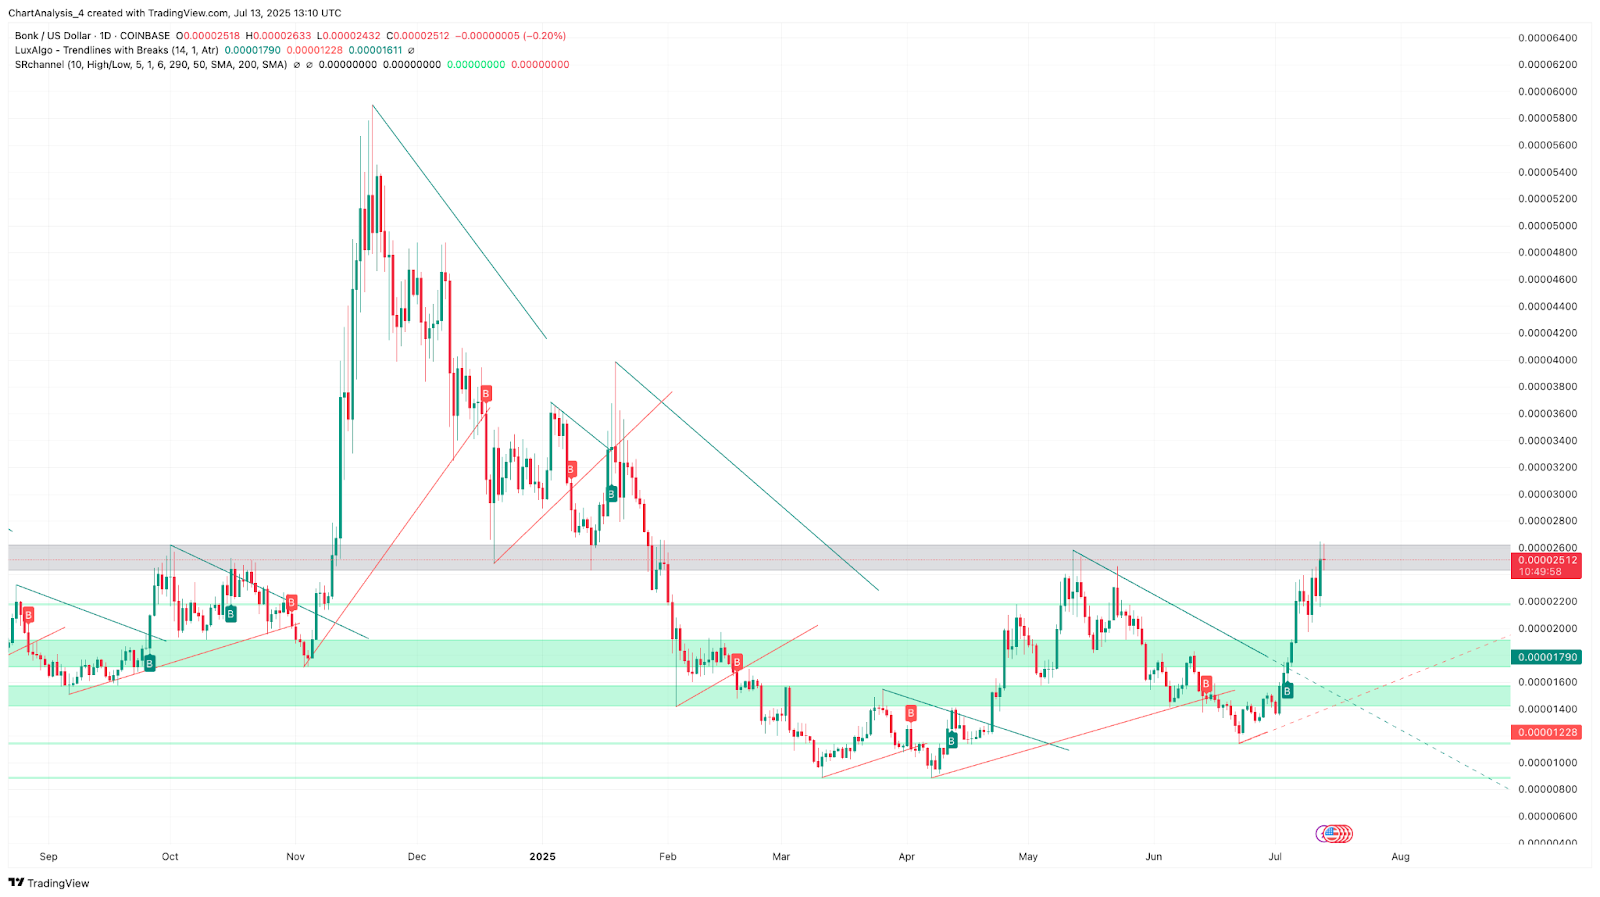
BONK price dynamics (Source: TradingView)
On the daily timeframe, Bonk price has rallied nearly 40% from its July 1 lows and is now hovering near a key supply zone between $0.00002580 and $0.00002630. This zone corresponds with the 1.0 Fibonacci extension of the prior swing structure. Multiple indicators suggest a bullish continuation may be in play, with Supertrend flipped green and Parabolic SAR trailing well below price.
BONK price dynamics (Source: TradingView)
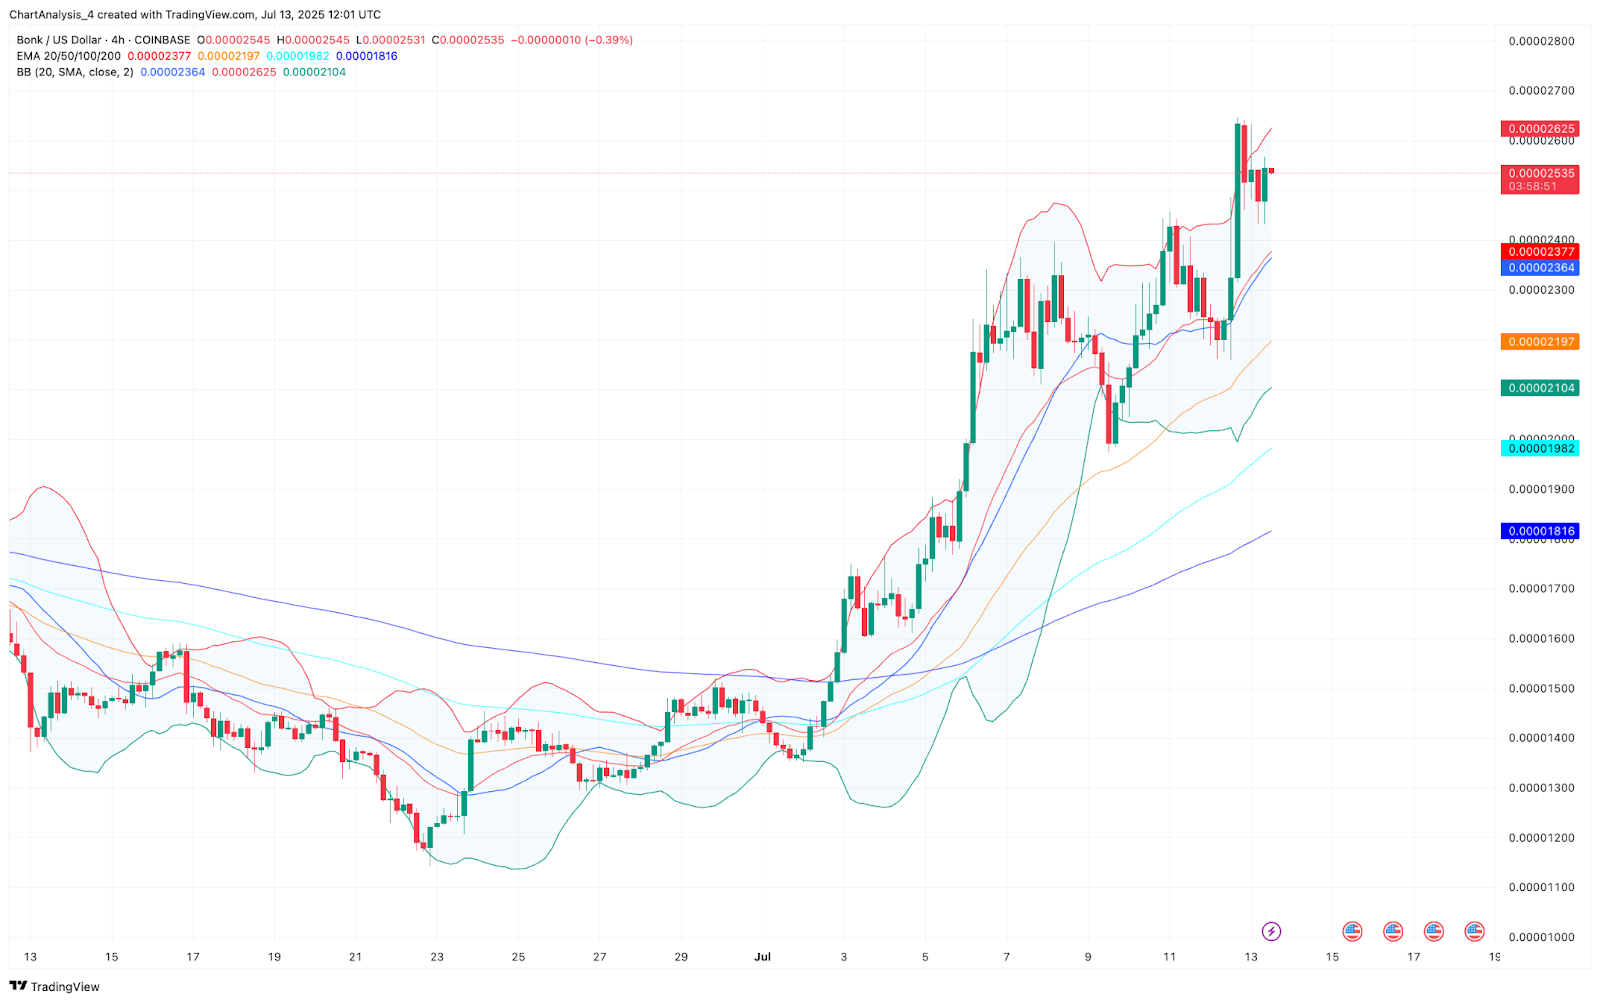
The 4-hour Bollinger Bands show a recent volatility expansion, followed by consolidation near the upper band, which is now sitting near $0.00002625. Price has also found dynamic support at the 20 EMA ($0.00002377), while higher EMAs like the 50 and 100 continue to fan out — confirming upward trend strength.
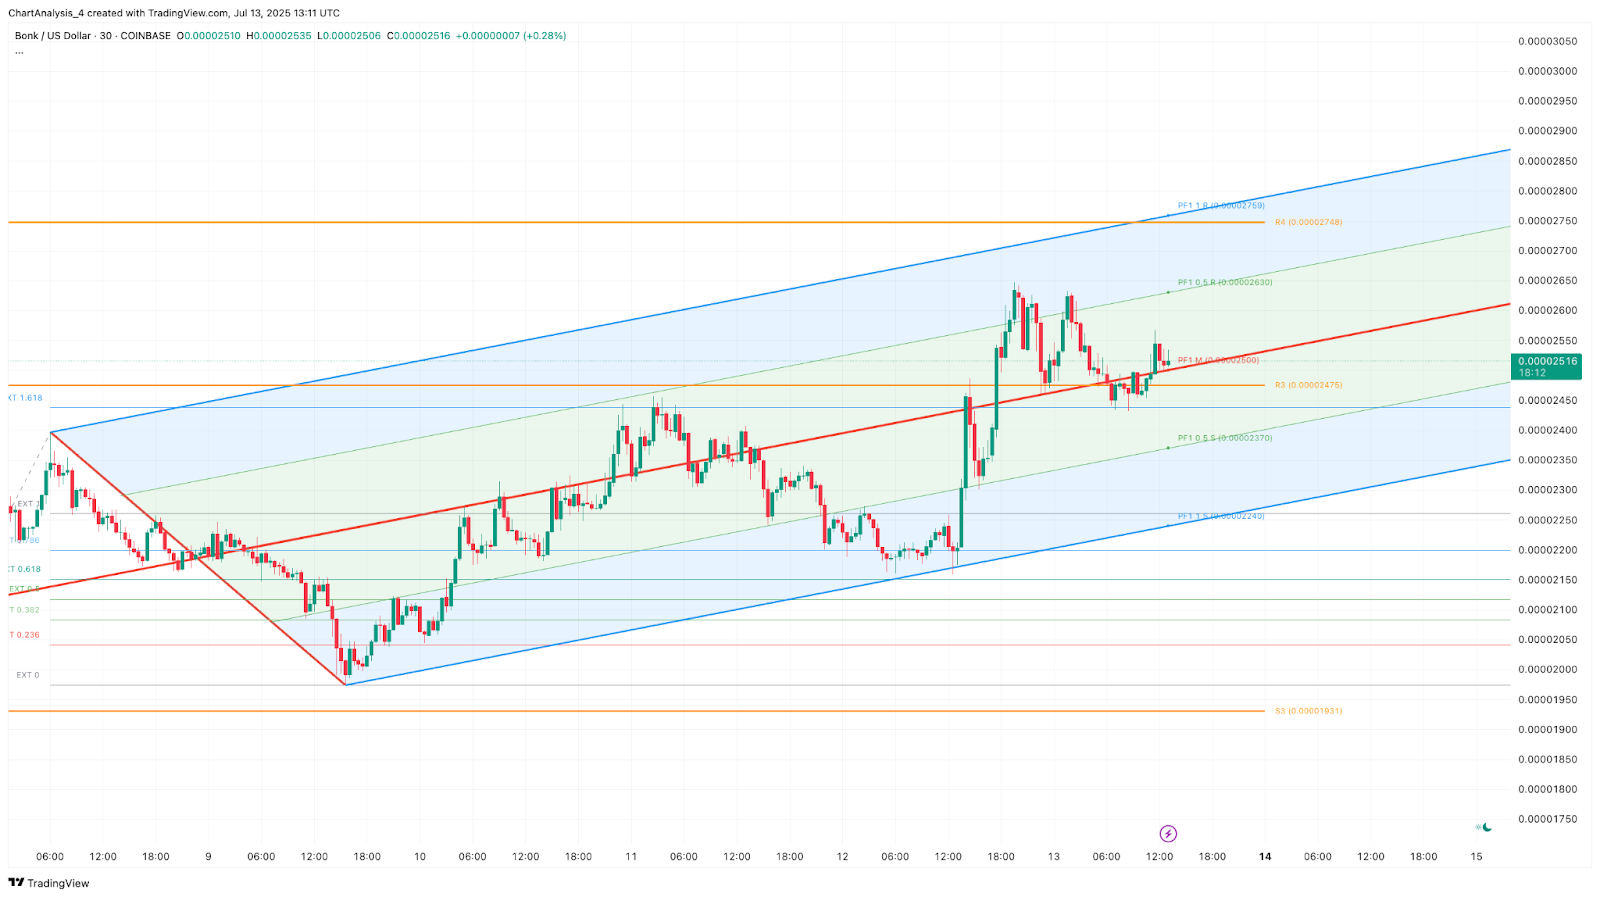
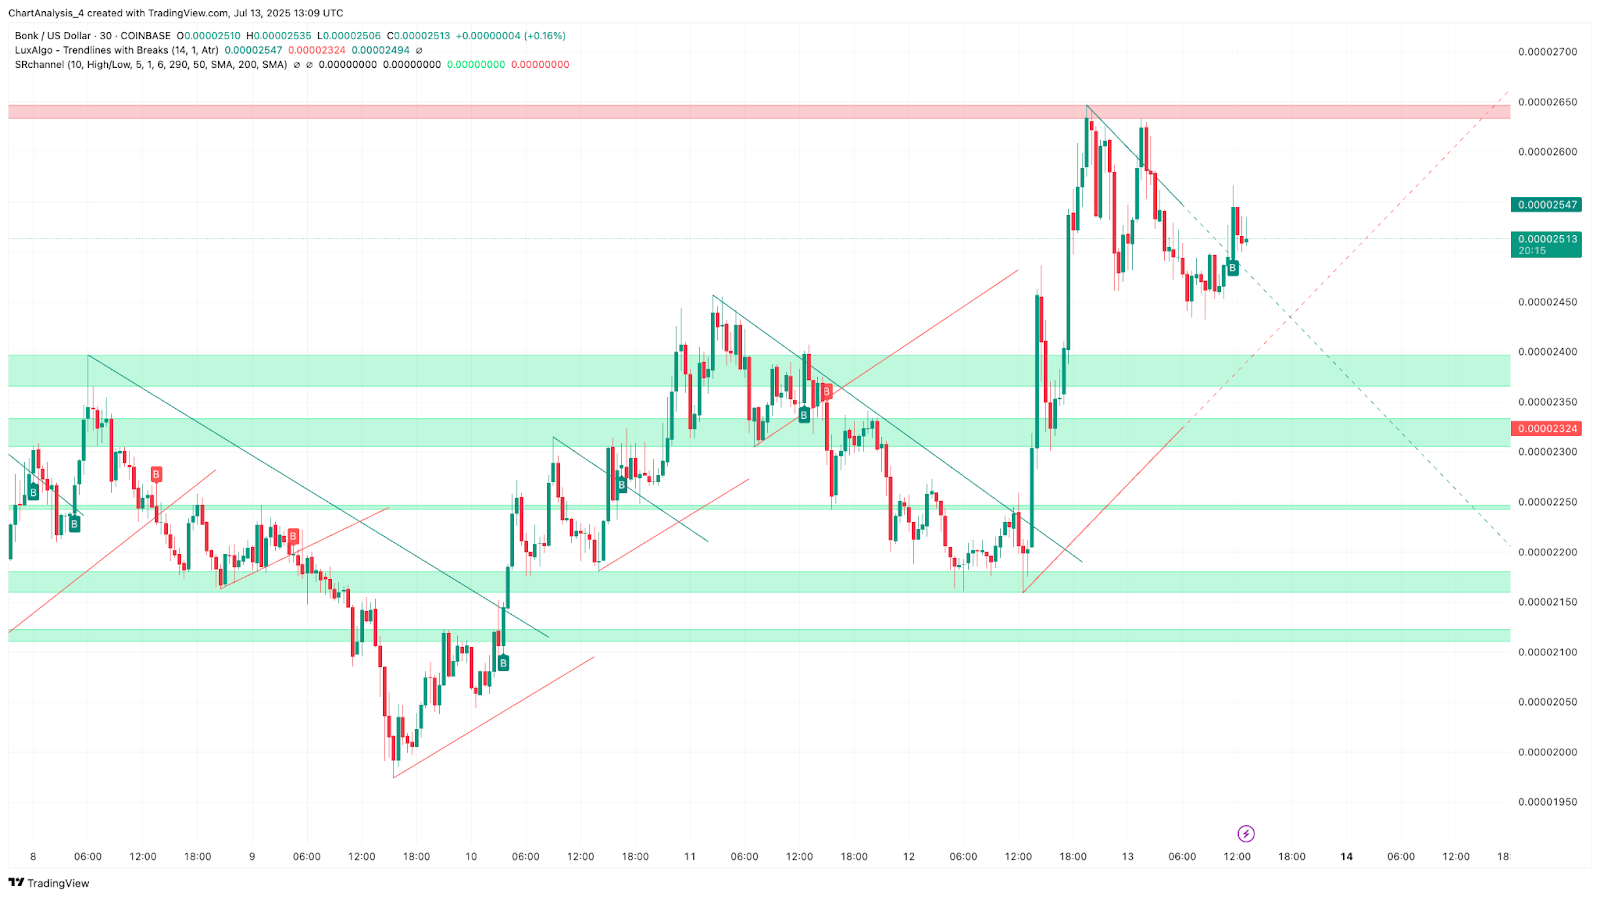
In the 30-minute structure, BONK is maintaining higher lows while trading within an ascending channel. The asset has reclaimed key levels near $0.00002470 and is now trading within a bullish flag-like compression, with potential to test $0.00002748 (Fib R4) if momentum revives.
Why Is The Bonk Price Going Up Today?
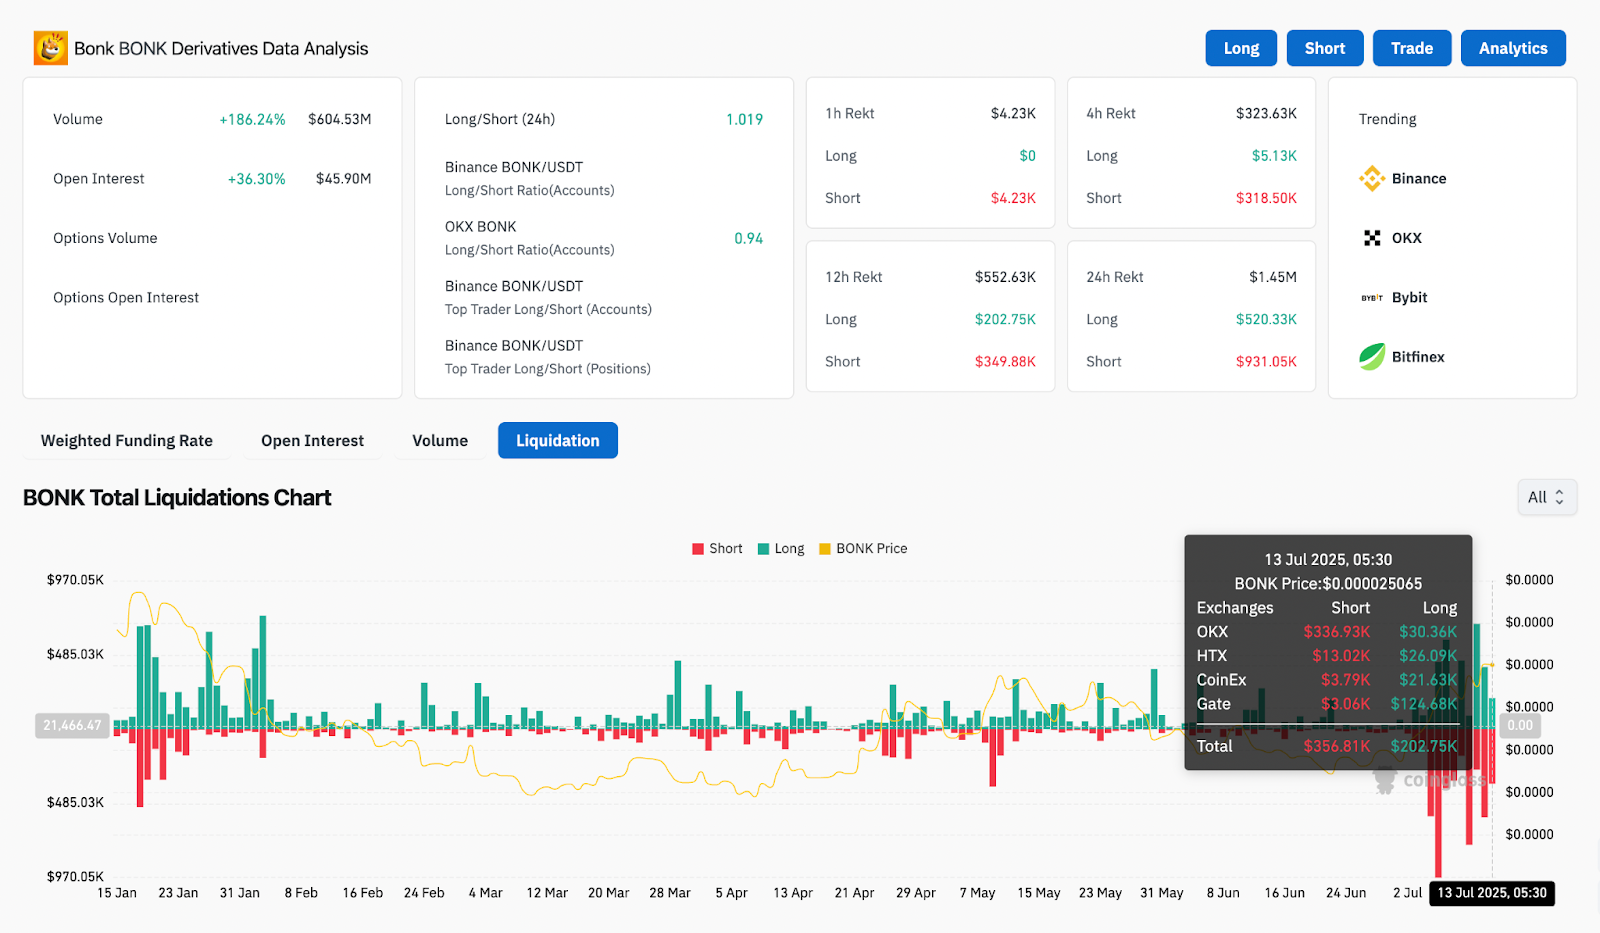
BONK Derivative Analysis (Source: Coinglass)
The current upside in Bonk price is supported by both technical momentum and aggressive derivatives activity. Coinglass data shows a 186.24% surge in 24-hour trading volume, with open interest rising by over 36% to $45.90 million. The long/short ratio remains slightly bullish at 1.019, suggesting traders are still positioned for upside continuation.
BONK price dynamics (Source: TradingView)
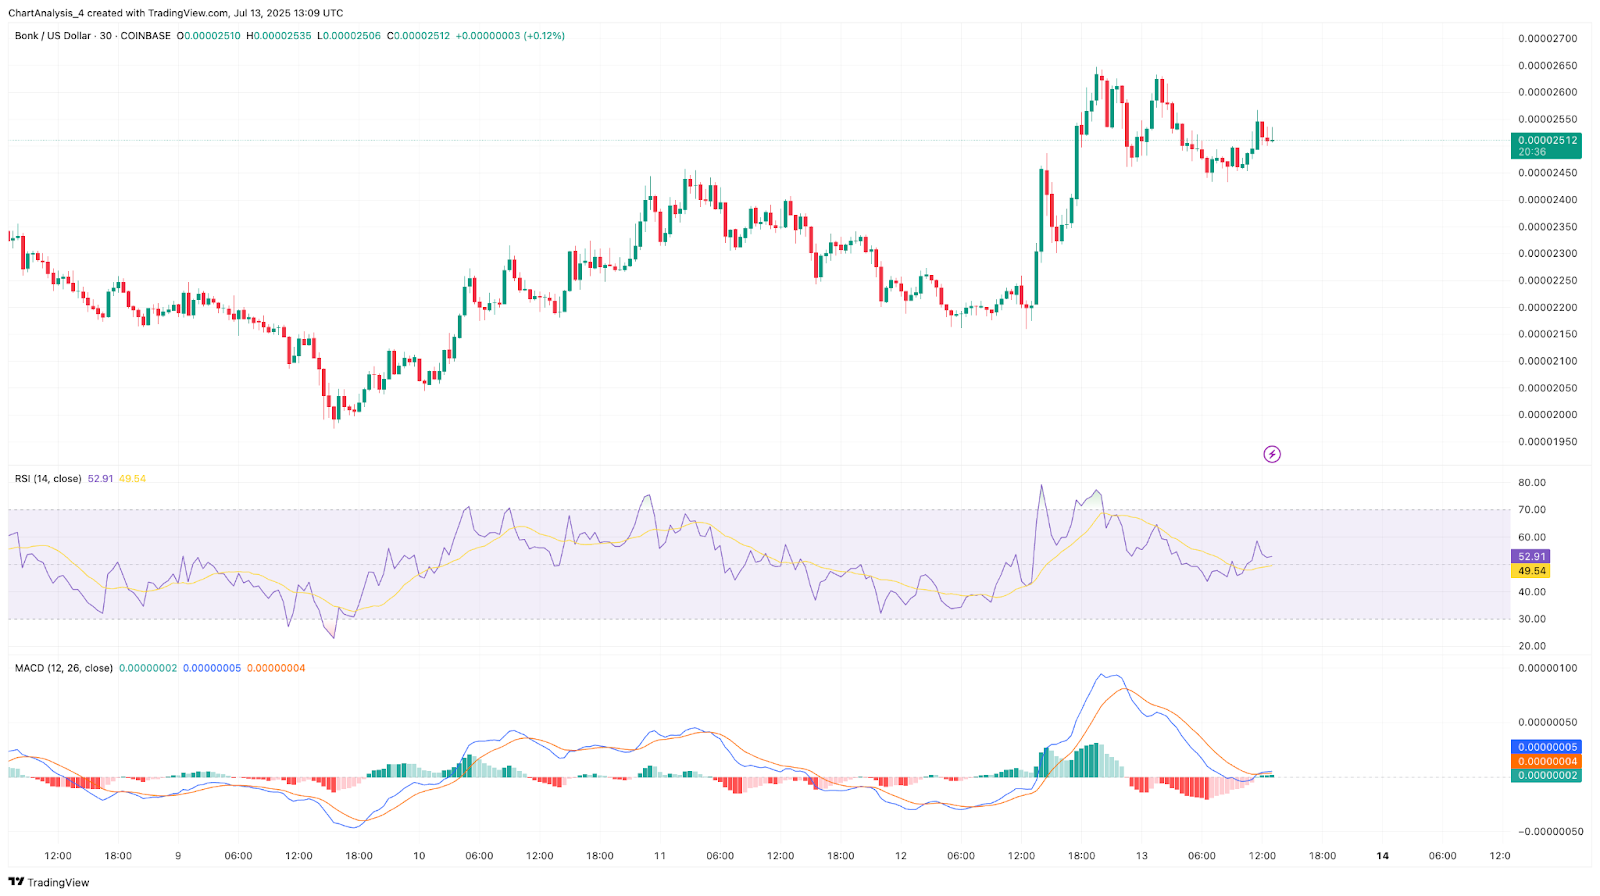
On the 30-minute chart, RSI currently stands at 52.9, recovering from earlier dips and indicating a neutral-bullish bias. Meanwhile, MACD has stabilized near the zero line after a bullish crossover, reflecting a potential pause before a new leg upward.
The key structural driver remains BONK’s clean break above $0.00002150 earlier this week, which flipped a critical resistance into support. Liquidation data confirms that shorts were squeezed during this move, particularly between $0.00002300 and $0.00002500, clearing the path for higher price discovery.
BONK Price Action Signals Trend Acceleration
BONK price dynamics (Source: TradingView)
BONK has respected the midline of the pitchfork channel drawn from its July 8 swing low. The asset is currently consolidating just above the midline support near $0.00002500, with upper channel resistance seen near $0.00002750. A breakout beyond this could trigger a rapid push toward the psychological $0.00003000 level.
BONK price dynamics (Source: TradingView)
The daily chart also shows a completed bullish reversal pattern from the prior downtrend, with a breakout above a long-standing descending trendline now confirmed.
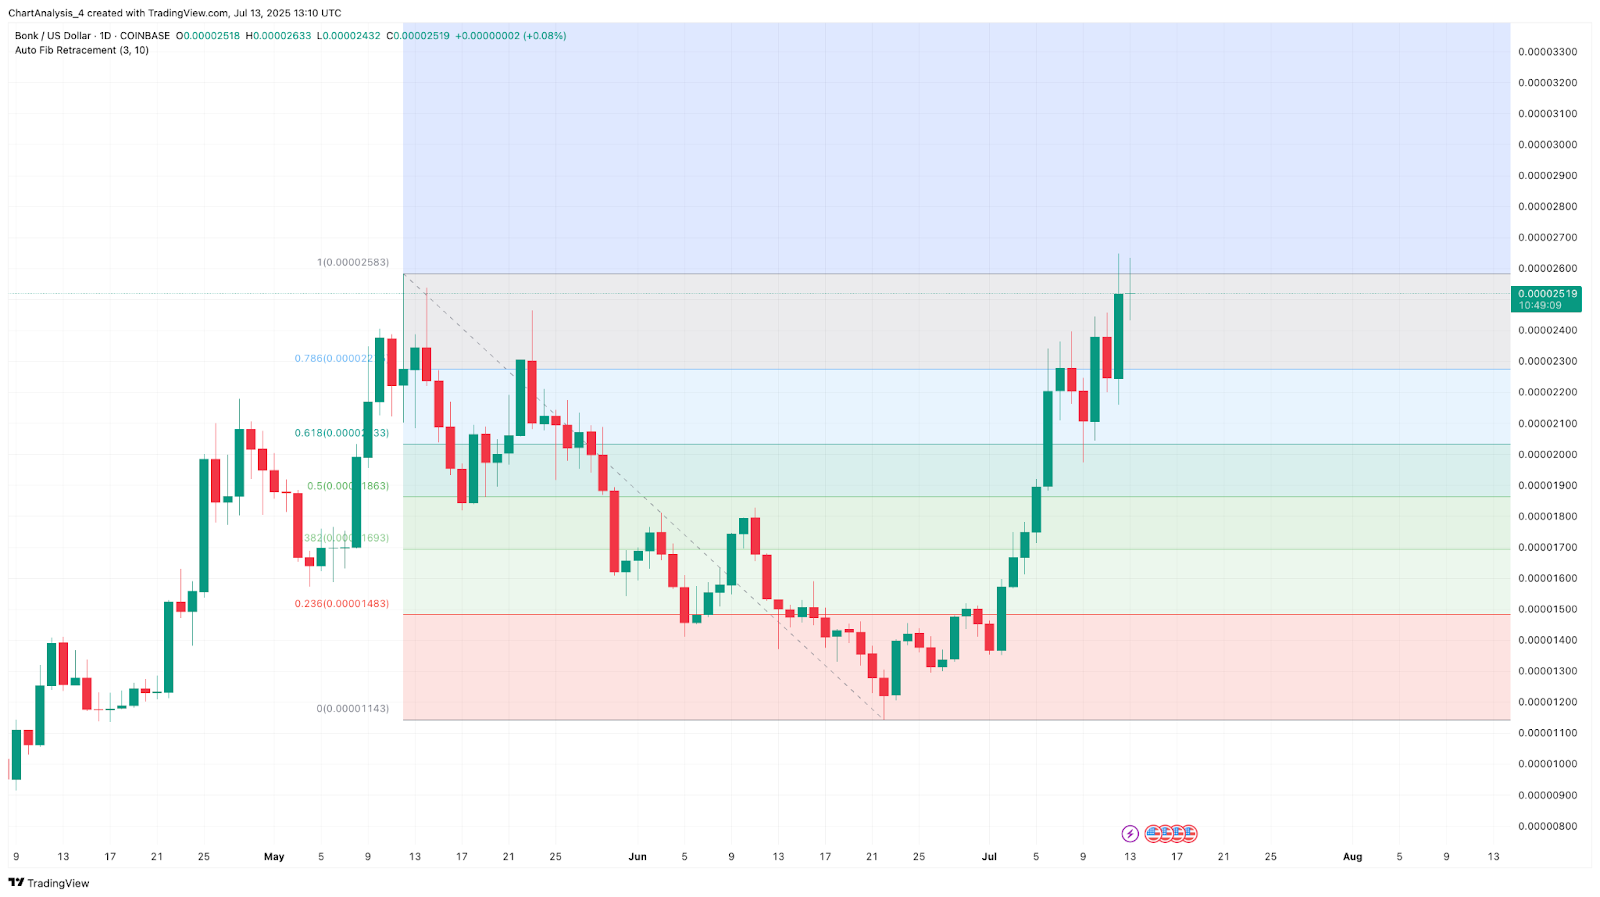
BONK price dynamics (Source: TradingView)
Fibonacci retracement zones indicate that price has cleared the 0.786 level at $0.00002485 and is targeting the previous swing high near $0.00002625.
BONK Price Prediction: Short-Term Outlook (24H)
BONK price dynamics (Source: TradingView)
Bonk price is expected to remain bullish as long as the $0.00002400–$0.00002450 support band holds. A break above $0.00002630 with volume confirmation could extend the rally toward $0.00002748 followed by $0.00003000. Failure to hold above $0.00002400, however, could open the door to a short-term retest of $0.00002300.
Given the rising EMAs, supportive RSI, neutral MACD, and strong derivatives flow, the setup continues to favor buyers. However, traders should monitor price reaction at $0.00002630 closely, as rejection here may trigger short-term pullbacks despite the broader uptrend.
Bonk Price Forecast Table: July 14, 2025
Disclaimer: The information presented in this article is for informational and educational purposes only. The article does not constitute financial advice or advice of any kind. Coin Edition is not responsible for any losses incurred as a result of the utilization of content, products, or services mentioned. Readers are advised to exercise caution before taking any action related to the company.


, Bull Run Incoming?")
